Update
6 min read
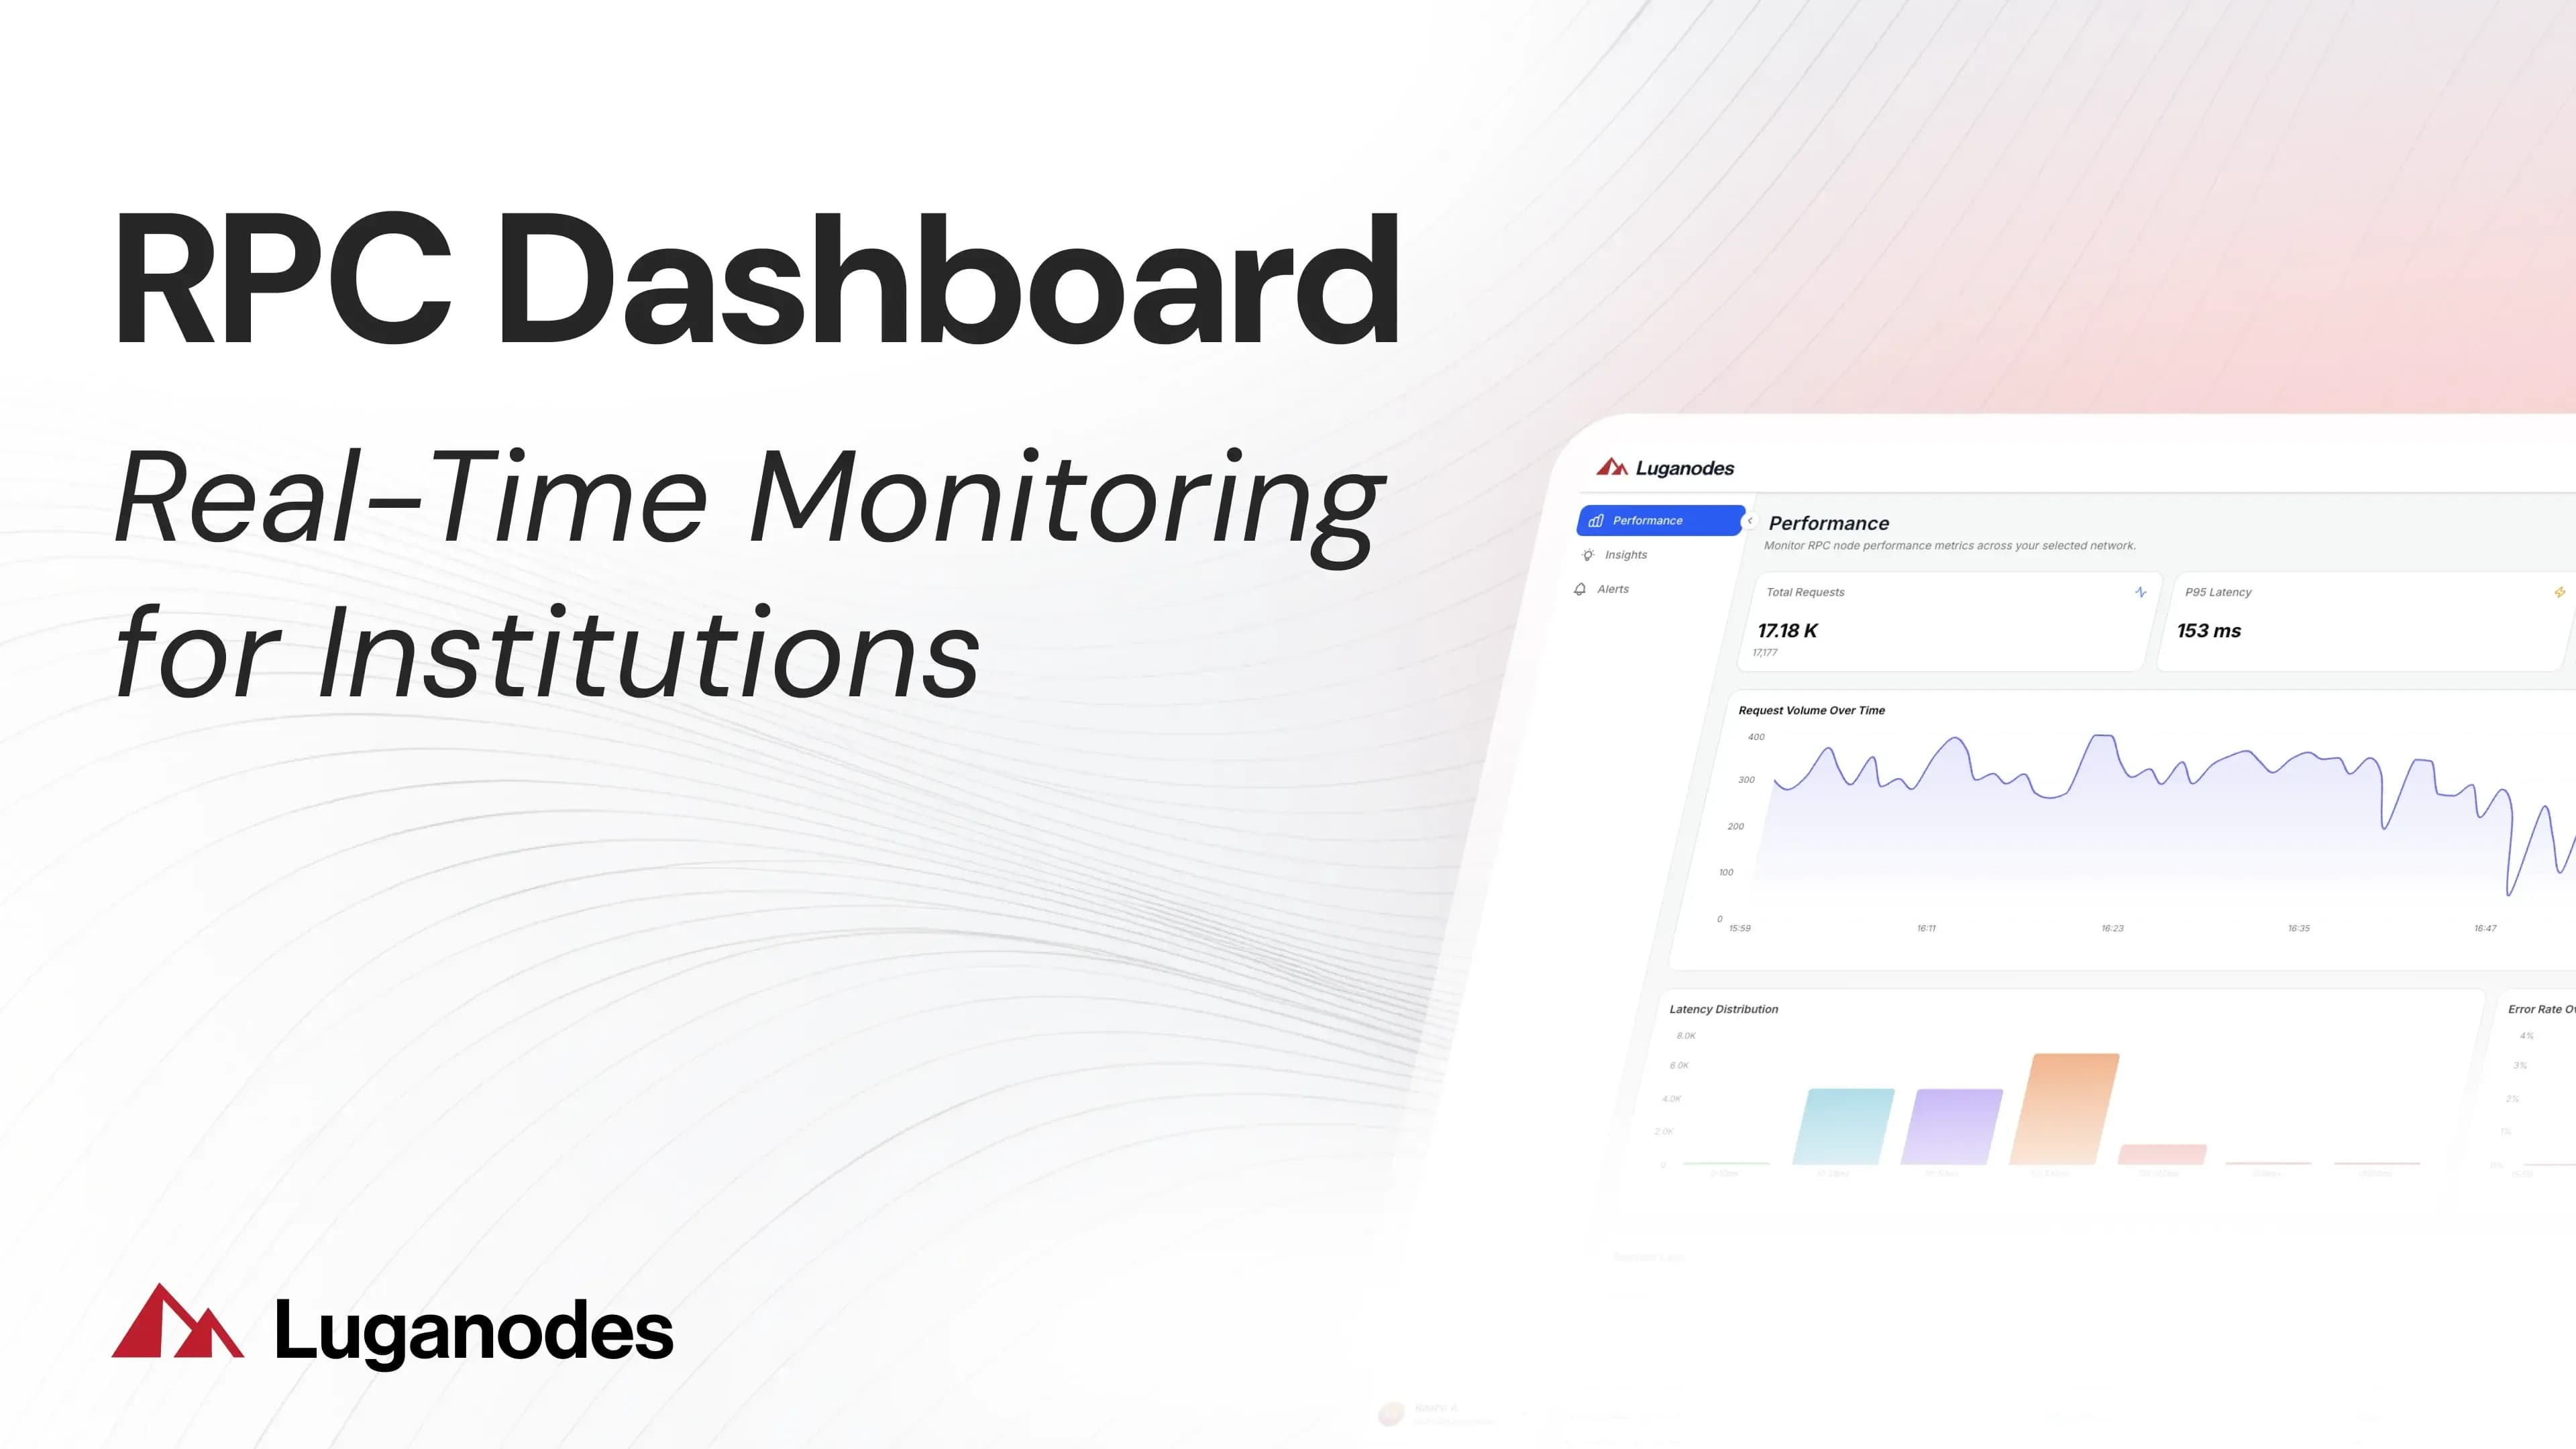
The Luganodes RPC Dashboard: Real-Time Monitoring for Institutions
One unified view of performance, insights, and alerts for our RPC clients
Published on
June 18, 2026
Introduction
The Luganodes RPC Dashboard is a monitoring and insights layer that ships with every Luganodes RPC deployment, available now to all RPC clients at no additional cost. Institutions running production blockchain workloads no longer have to choose between the operational visibility of self-hosted infrastructure and the reliability of a managed service. The dashboard gives you both: a single, institutional-grade view of how your endpoints are performing, who is calling them, and when something needs attention, across every supported network.
Why institutional RPC needs more than an endpoint
A reliable endpoint is the baseline. Once an integration goes live, risk, engineering, and finance departments often face a more difficult challenge: how can they verify that their critical infrastructure is meeting contractual performance standards without the friction of filing support tickets or awaiting manual reports?
RPC Providers have traditionally answered this with fragmented per-chain tools, external observability platforms, or periodic uptime reports. The RPC Dashboard replaces all of it with one unified interface. You get the observability of running your own infrastructure with none of the burden of building it, with every metric available across each network you run with Luganodes, from Ethereum and Polygon to Bitcoin and custom deployments.
What the dashboard includes
The dashboard is organized into three views, each scoped to a 1-hour, 24-hour, 7-day, or 30-day window:
Performance, for developers and SRE teams who need real-time, request-level health. High-level indicators like total requests, P95 latency, success rate, and error counts sit alongside detailed charts for volume, latency distribution, and method breakdowns. A request log preserves individual call data for three days for live incident diagnosis.
Insights, for product and operations teams who need to understand how endpoints are actually used. It maps request origins by country, analyzes client distribution, tracks hourly usage, and surfaces the specific user-facing errors end users hit, so your team can resolve issues before they become support tickets.
Alerts, for anyone who needs to know about an issue or metric before users do. Set custom thresholds on metrics like error rate and P95 latency, get notified the moment a breach occurs and again once conditions stabilize, with every trigger logged in an auditable alert history.
Built to institutional standards
The infrastructure behind the dashboard is SOC 2 Type II certified, ISO 27001 aligned, and GDPR compliant, the standards custodians, exchanges, and digital asset treasuries require. It reflects the company already trusted to secure more than $2.9B in staked assets for 60-plus institutions.
Available now
The RPC Dashboard is included with the Luganodes RPC service and requires no setup on your side. Our RPC infrastructure supports 40+ chains, and the dashboard works across all of them out of the box. Every engagement begins with white-glove onboarding, with dashboard access and user management handled by our team as part of provisioning.
If you already run on Luganodes RPC, speak to your business account manager to get your users added. If you are evaluating institutional RPC infrastructure and want a managed service with this level of visibility built in, reach out to us at business@luganodes.com.
Frequently Asked Questions
Does the Luganodes RPC dashboard cost extra?
No. The RPC Dashboard is included with every Luganodes RPC service at no additional cost. Access and user management are set up by the Luganodes team during white-glove onboarding, so there is nothing to install or configure on your side.
How do I monitor RPC performance and uptime in real time?
The Luganodes RPC Dashboard provides a real-time Performance view showing total requests, P95 latency, success rate, and error count, alongside charts for request volume, method distribution, and latency distribution. You can scope every metric to a 1-hour, 24-hour, 7-day, or 30-day window. This gives institutional teams live visibility into whether their endpoints are performing against the SLAs without building their own observability stack.
Can I see which RPC methods and countries are driving my traffic?
Yes. The Insights view breaks down traffic by RPC method, by geography with a ranked list of top countries, by device and platform, and by hour of day. It also surfaces the top user-facing errors your end users encounter, such as execution reverted or insufficient funds. Luganodes built this view so product and operations teams can understand usage, not just uptime.
Can I get alerted when error rates or latency spike?
Yes. The Alerts view lets you set thresholds on metrics such as error rate and P95 latency, evaluated over a rolling five-minute window, and notify a list of email recipients. Each alert fires once on breach and sends a resolution email when conditions clear, and a full alert history records every trigger with the threshold and actual value. This lets Luganodes clients act on issues before their users notice them.
How long are RPC request logs retained?
The Luganodes RPC Dashboard retains individual request logs for three days, including the timestamp, method, latency, and status of each call, with filtering by method and status code. This window is designed for diagnosing live incidents and reviewing recent behavior, and it sits alongside longer-range trend charts that cover up to 30 days.
Is the Luganodes RPC dashboard suitable for institutions?
Yes. The dashboard runs on infrastructure that is SOC 2 Type II certified, ISO 27001 aligned, GDPR compliant, and fully non-custodial. Luganodes secures more than $2.9B in staked assets for 60-plus institutions including custodians, exchanges, and digital asset treasuries, and the RPC Dashboard extends that same institutional standard to monitoring and reporting.
About Luganodes
Luganodes is a world-class, non-custodial blockchain infrastructure provider that has rapidly gained recognition in the industry for offering institutional-grade services. It was born out of the Lugano Plan B Program, an initiative driven by Tether and the City of Lugano. Luganodes maintains an exceptional 99.9% uptime with round-the-clock monitoring by SRE experts. With support for 40+ PoS networks and serving 60+ institutional cliens, it ranks among the top validators on Polygon, Polkadot, Sui, and Tron. Luganodes prioritizes security and compliance, holding the distinction of being one of the first staking providers to adhere to all SOC 2 Type II, GDPR, and ISO 27001 standards as well as offering Chainproof insurance to institutional clients.
The information herein is for general informational purposes only and does not constitute legal, business, tax, professional, financial, or investment advice. No warranties are made regarding its accuracy, correctness, completeness, or reliability. Luganodes and its affiliates disclaim all liability for any losses or damages arising from reliance on this information. Luganodes is not obligated to update or amend any content. Use at your own risk. For specific guidance, please consult a qualified professional.